The gdb debugging tool is widely used by developers to introspect the execution environment of an application, revealing both its code and data state at any point. Snaps can use gdb to debug both locally and remotely.
- Local debugging with gdb
- Generate debug symbols
- Local debugging with gdbserver
- Remote debugging with gdbserver
- Debugging with VS Code
Local debugging with gdb
As snaps are run within a confined environment, running gdb directly against a snap executable would introspect both the snap environment and the application itself, making the identification of any issues specific to the snap application much more difficult.
For this reason, the snap daemon embeds gdb within its own framework, allowing developers to call it directly against an installed snap with the run argument:
sudo snap run --gdb <snapname>
When GDB is instantiated in this way, it behaves just as it would were it called against the same executable outside of the snap environment.
For general advice on fixing potential issues in running snaps, see Debugging snaps. Guidance on using GDB is outside the scope of our documentation, but a good place to start is the Sample GDB Session in the official documentation.
Generate debug symbols
The majority of snaps do not ship with binaries that include debug symbols, and this means GDB can’t typically link to the original source to allow further analysis.
One solution is to build your own snaps with debug symbols enabled, and install them locally with the --devmode argument.
For example, to debug a typical C-based project using the CMake plugin, add set(CMAKE_BUILD_TYPE Debug) to its CMakeLists.txt and rebuild the snap.
After installing the snap and running GDB, the symbols will be located and the source code can be referenced, as shown below:
$ snap install test-gdb_0.1_amd64.snap --devmode
test-gdb 0.1 installed
$ snap run --gdb test-gdb.test-gdb
[...]
You are right before your application is execed():
- set any options you may need
- use 'cont' to start
[...]
(gdb) dir test-gdb/src/
Source directories searched: test-gdb/src:$cdir:$cwd
(gdb) list
1       #include <stdio.h>
2
3       int main (int argc, char *argv[])
4       {
5         printf ("GDB from a snap is working\n");
6
7         return 0;
8       }
(gdb) cont
Continuing.
GDB from a snap is working
[Inferior 1 (process 153259) exited normally]
(gdb) quit
See Collecting debug symbols for the forum discussion related to how snaps might bundle debug symbols.
Local debugging with gdbserver
In addition to the gdb command (see above), the snap daemon can work with gdbserver for remote access. This is often a better way to debug because it combines gdb functionality with the convenience of alternative frontends, remote access, and the ability to run applications as a normal user.
The gdbserver executable will need to be installed manually:
sudo apt install gdbserver
To run gdbserver, issue the following command for your own snap:
$ snap run --gdbserver <snapname>
Welcome to "snap run --gdbserver".
You are right before your application is run.
Please open a different terminal and run:

gdb -ex="target remote :43041" -ex=continue -ex="signal SIGCONT"
(gdb) continue

or use your favorite gdb frontend and connect to :33597
You may be asked for your [sudo] password.
Use --gdbserver=:<my-port> to request a specific port and to keep the port from changing with each run, such as --gdbserver=:43041.
You can now access the GDB session from your favourite frontend, or from gdb itself, running outside of the snap:
$ gdb -ex="target remote :43041"
GNU gdb (Ubuntu 12.1-0ubuntu1~22.04) 12.1
[...]
(gdb)
Remote debugging with gdbserver
A gdbserver session can be started remotely via SSH, or by passing the command to through SSH directly:
ssh <username>@<target IP address> "sudo snap run --gdbserver=:4301 <snapname>"
For the above, you will need to have openssh-askpass or equivalent installed and configured, or pass the -S option with SSH to enter the password into the terminal.
To now debug a snap remotely, ensure any firewalls are set to permit the relevant ports (or are disabled) and precede the gdp port argument with the IP address of the target system running the snap:
gdb -ex="target remote 192.168.122.138:43041"
After connecting to the session, you will need to issue several cont (continue) commands before reaching the exec() of the application. At which point, the original gdbserver session will output the following:
Welcome to `snap run --gdb`.
You are right before your application is execed():
- set any options you may need
- (optionally) set a breakpoint in 'main'
- use 'cont' to start
From the above point, you can debug your application normally.
Remote debugging with VS Code
Most IDEs can be used to visually debug snaps running gdbserver with either gdb or gdb-multiarch packages. An IDE needs to be configured to access the target host gdbserver session rather than use its default debug routine, and optionally, to automatically the execution of the snap with gdbserver before the debugger starts.
To create a configuration for Microsoft’s Visual Studio Code (VS Code) , for example, you will need a workspace with local access to the same source code as the snap, and the executable, along with the VS Code GDB Debug extension. The executable can be extracted form the snap package with the unsquashfs <snap name> command.
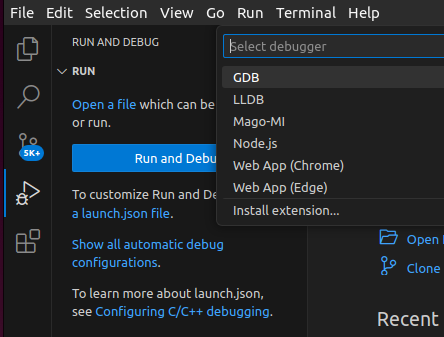
In VS Code, open your workspace and select Run and Debug from the primary side bar and click create a launch.json file, then select GDB from the list of debuggers:
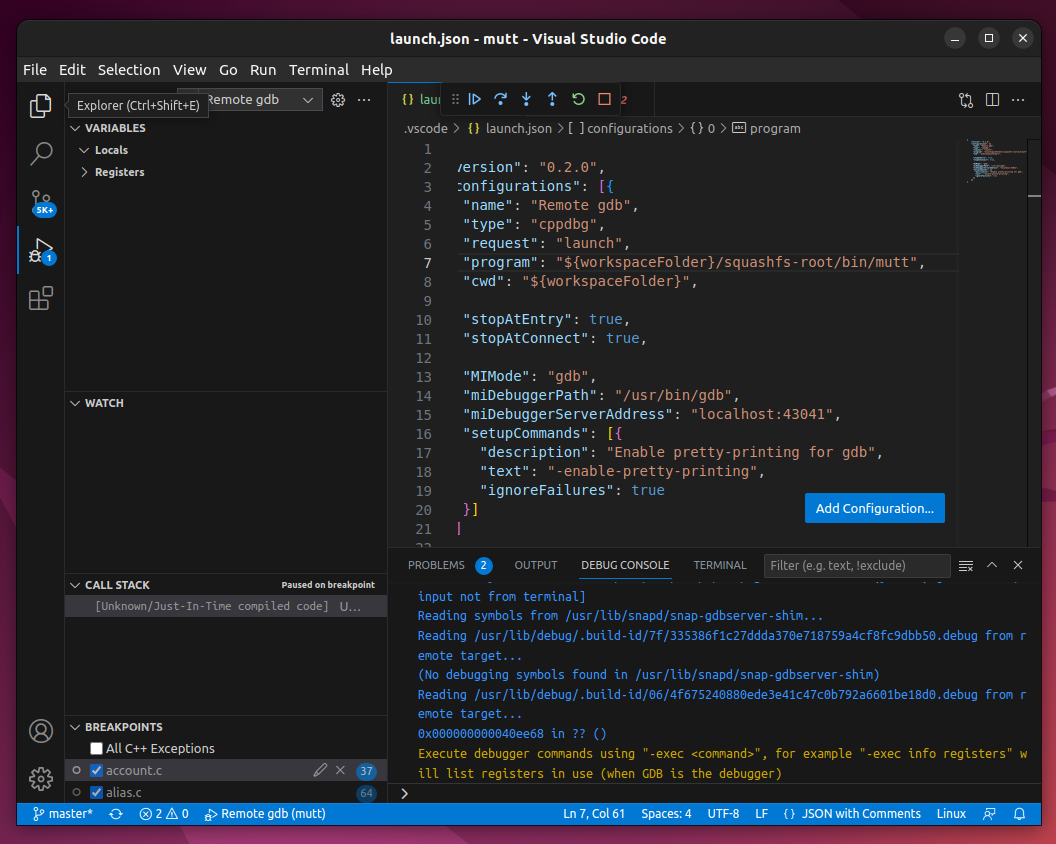
This will open a template launch.json file in the editor which can be configured to access the remote snap gdb session. Replace the contents of this file with the following to create a new entry called Remote gdb:
{
    "version": "0.2.0",
    "configurations": [{
      "name": "Remote gdb",
      "type": "cppdbg",
      "request": "launch",
      "program": "${workspaceFolder}/squashfs-root/bin/<executable>",
      "cwd": "${workspaceFolder}",

      "stopAtEntry": true,
      "stopAtConnect": true,

      "MIMode": "gdb",
      "miDebuggerPath": "/usr/bin/gdb",
      "miDebuggerServerAddress": "192.168.122.138:43041",
      "setupCommands": [{
        "description": "Enable pretty-printing for gdb",
        "text": "-enable-pretty-printing",
        "ignoreFailures": true
      }]
    }]
}
The above example uses the target IP address and port of 192.168.122.138:43041. This will need to be changed to match your configuration, or to localhost:port to debug a snap with VS Code locally. Similarly, the <executable> path needs to point at the executable from the snap you wish to debug.
Save the file and set some breakpoints in the code before returnin to the Run and Debug window. You should now see the option to run the new Remote gdb configuration:
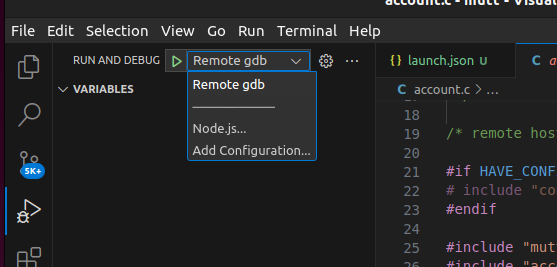
Press the small play icon to connect to an already running snap gdbserver. You can now debug a running snap just as you would a normally built executable.